문서의 목적 Eclipse 3.3.2 와 TPTP 4.4.1 을 이용해서 원격 JVM 에서 실행되고 있는 Java Application 을 Profiling 하는 방법을 알아본다. 이 문서는 'Eclipse 3.3.2 과 TPTP 4.4.1 을 이용한 Profiling (Eclipse Java Project)' 문서를 통해 TPTP 를 Profiler 로 먼저 써보았다고 가정한다. 이 문서는 http://mindwing.kr/131 을 참조한다.
Remote site 에서 Profiliing 할 Application 준비하기 우선, Profiling 을 할 테스트 프로그램을 만들어야 하는데, 이 문서에서는 다음 소스코드를 이용해서 C:\Users\handan\tptp\LookAtMe\bin\lookatme 에 클래스 파일을 만든 것으로 간주한다. (별도로 Profiling 할 프로그램이 있다면 그것을 써도 된다.) package lookatme; public class LookAtMe extends Thread
{
private long sleepTime; private int count; private static int getCount; LookAtMe(long sleepTime)
{
this.sleepTime = sleepTime; count = getCount();
} private static int getCount()
{
Synchronized (LookAtMe.class)
{
return ++getCount;
}
} public void run()
{
while (true)
{
System.out.printf("%d: %d\n", count, sleepTime); try
{
sleep(sleepTime);
} catch (InterruptedException e)
{
e.printStackTrace();
}
}
} public static void main(String[] args)
{
new LookAtMe((System.currentTimeMillis() % 3000) + 100).start();
new LookAtMe((System.currentTimeMillis() % 3000) + 300).start();
new LookAtMe((System.currentTimeMillis() % 3000) + 500).start();
new LookAtMe((System.currentTimeMillis() % 3000) + 700).start();
new LookAtMe((System.currentTimeMillis() % 3000) + 900).start();
}
}
다음 화면과 같이 컴파일한다. 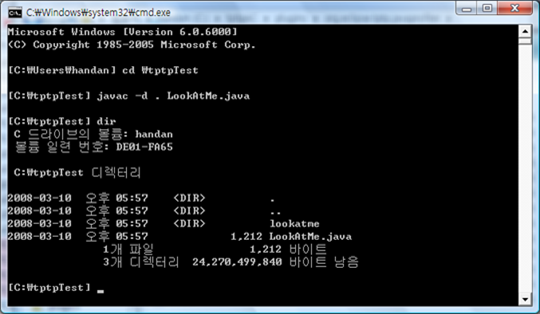
Remote site 에 TPTP 4.4.1 설치하고 실행하기 Eclipse 내에서 실행되는 Application 을 profiling 하기 위해서는 Integrated Agent Controller 를 쓰면 되기 때문에 Eclipse 외에 별도의 설치가 필요없다. 하
지만, Remote site 에서 실행되는 Application 을 Profiling 하기 위해서는 Remote site 에
별도의 TPTP Agent Controller 를 설치해줘야 한다. (이 문서에서는 하나의 컴퓨터에서 모두 설정하지만,
Eclipse 가 실행되는 환경과 Remote site 는 별개의 컴퓨터라고 샘각해야 한다.) Remote site 에 TPTP Agent Controller 를 설치하려면, 다음 URL 에서 Remote site 의 환경에 맞는 TPTP 를 설치한다. http://www.eclipse.org/tptp/home/downloads/ 이 글에서는 다음 화면과 같이 C:\tptpAC 에 'WINDOWS-IA32' 를 설치했다고 가정한다. 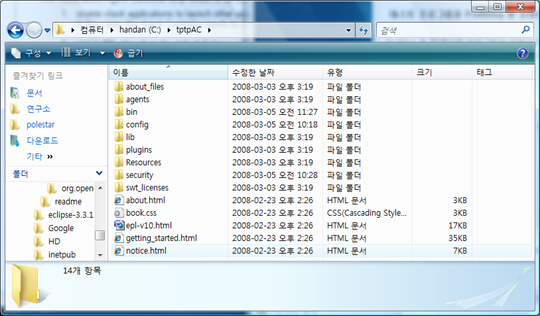
다음 두 가지 시스템 프로퍼티 설정을 한다. - TPTP_AC_HOME
- JAVA_PROFILER_HOME
- C:\tptpAC\plugins\org.eclipse.tptp.javaprofiler
- PATH 에 추가
처음 실행하는 것이라면 다음과 같이 커맨드 창을 열어서 SetConfig 를 실행하고, 기본설정값을 설정하기 위해 엔터키를 계속 눌러준다. 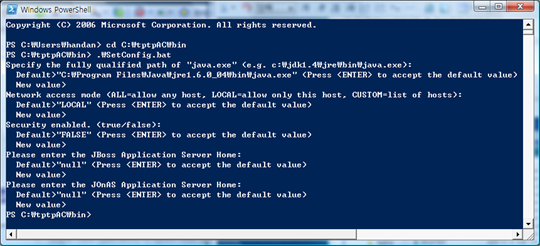
이제 Remote site 에서 Agent Controller 를 실행해야 하는데, 우선 커맨드 창에서 테스트 프로그램이 설치된 디렉토리인 C:\tptpTest 디렉토리로 이동한다. 다음과 같이 입력해서 결과값을 확인한다. [C:\tptpTest] java -agentlib:JPIBootLoader=JPIAgent:help;CGProf @(#)JVMTI Agent version 1.0.0.1
Usage:
-agentlib:JPIBootLoader=JPIAgent[:[help]|[<option>=<value>, ...]];<profiler> Where:
help Displays this message
<option>=<value> Command line options (see below)
<profiler> The profiler to launch:
CGProf Execution time analysis
HeapProf Memory analysis
ThreadProf Thread analysis Supported option names and values:
server=standalone|enabled|controlled
file=<file> Output file (default is trace.trcxml)
Only applicable when server=standalone
filters=<file> Filter definition file (default is filters.txt)
Only applicable when server=standalone
profiler=<file> Profiling options file (default is jvmti.pro)
Only applicable when server=standalone Examples Execution time analysis in standalone mode:
java -agentlib:JPIBootLoader=JPIAgent:server=standalone,file=log.trcxml;CGProf <
Java class file> Memory analysis in controlled mode:
java -agentlib:JPIBootLoader=JPIAgent:server=controlled;HeapProf <Java class fil
e> Error occurred during initialization of VM
agent library failed to init: JPIBootLoader 이렇게 안내문이 출력되면 설정은 잘 된것이다. 추가로, 다음과 같이 Eclipse 없이 독자적으로 Profiling 을 하는 Standalong 모드로 실행해서 Profiling 이 잘 되는지를 확인해본다. [C:\tptpTest] java -agentlib:JPIBootLoader=JPIAgent:server=standalone;CGProf loo
katme.LookAtMe
3: 3371
5: 3772
2: 3171
1: 2970
4: 3572
1: 2970
2: 3171
3: 3371
4: 3572
5: 3772
1: 2970
2: 3171
..... 참고로, 주황색 부분인 CGProf 는 Profiling 모드를 지정하는 것으로 다음과 같은 값이 가능하다. - CGProf
- HeapProf
- ThreadProf
그리고, Agent Controller 는 TCP 포트 10002, 10005, 10006 을 사용하므로, 필요하다면 이 포트를 이용할 수 있게 관련 설정등을 해준다. 이
제 Eclipse 의 TPTP 에서 Remote site 의 테스트 프로그램으로 접속할 수 있도록 다음과 같이 TPTP
Agent Controller 를 실행한다. 우선은 Execution Time Analysis 모드로 해본다. [C:\tptpTest] java -agentlib:JPIBootLoader=JPIAgent:server=controlled;CGProf loo
katme.LookAtMe 이제 Eclipse 에서 다음 화면과 같이 Attach to Agent 로 Profiling Configuration 을 만든다. 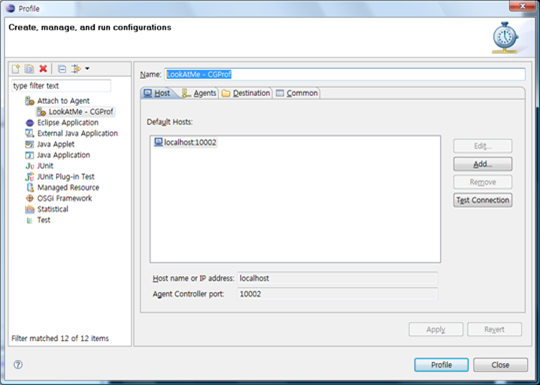
화면에서 localhost:10002 포트가 잡힌 것은 Eclipse 를 실행하는 컴퓨터에서 TPTP Agent Controller 를 설치했기 때문으로 실제로는 해당 서버를 지정해야 한다. 이제 Test Connection 을 눌러서 다음 화면과 같이 잘 연결됨을 확인한다. 
Agent 탭으로 가서 Refresh 버튼을 누르면 다음과 같이 이미 설정된 Execution Time Analysis 용 TPTP Agent 가 보이는 것을 확인할 수 있다. 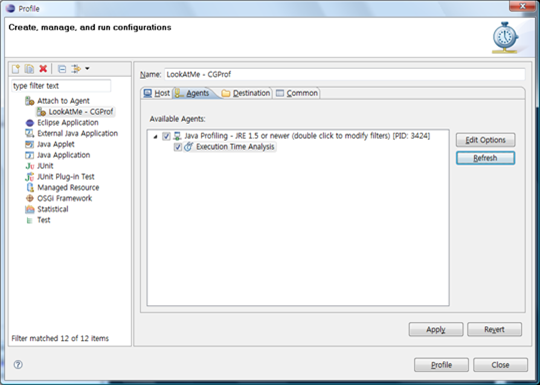
이제 Profile 버튼을 눌러서 바로 Profiling 을 실행할 수 있다. 다음 화면은 Eclipse 상에서 Profiling 이 실행되는 모습이다. 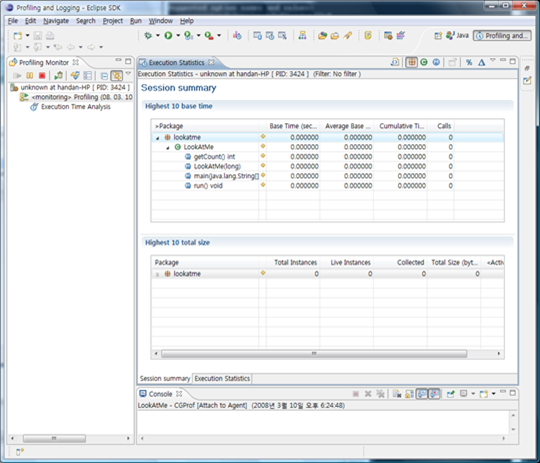
다음 화면은 TPTP Agent Controller 를 실행한 콘솔창의 모습으로 프로그램이 실행되고 있는 것을 알 수 있다. 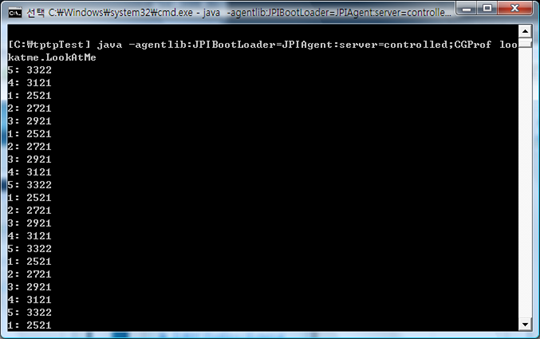
이제 HeapProf 과 ThreadProf 에 대한 Profiling Configuration 을 추가하고, 적절하게 Remote site 에서 Agent Controller 를 실행해준다. 다음 화면은 HeapProf 로 실행한 Eclipse 의 모습이다. 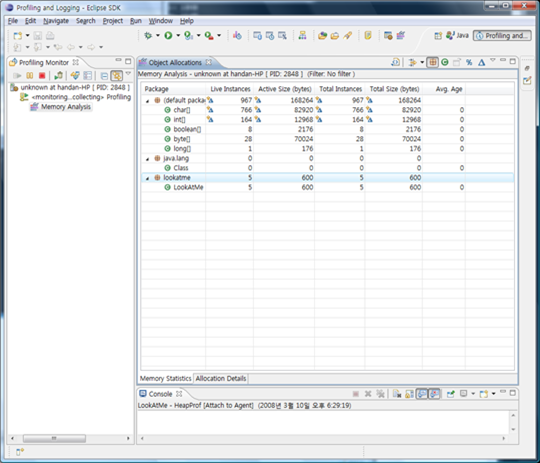
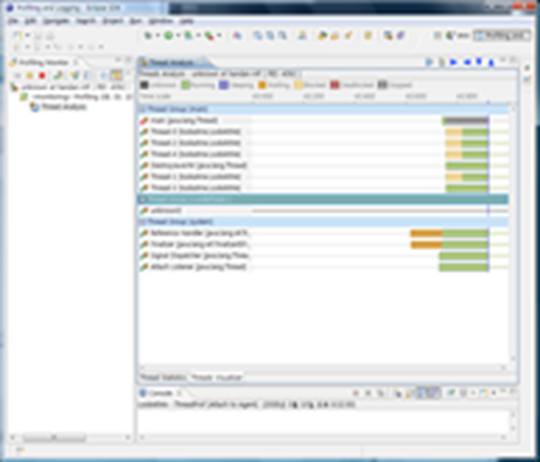
다음 화면은 ThreadProf 로 실행한 Eclipse 의 모습이다.
출처 : http://mindwing.kr/132
|

